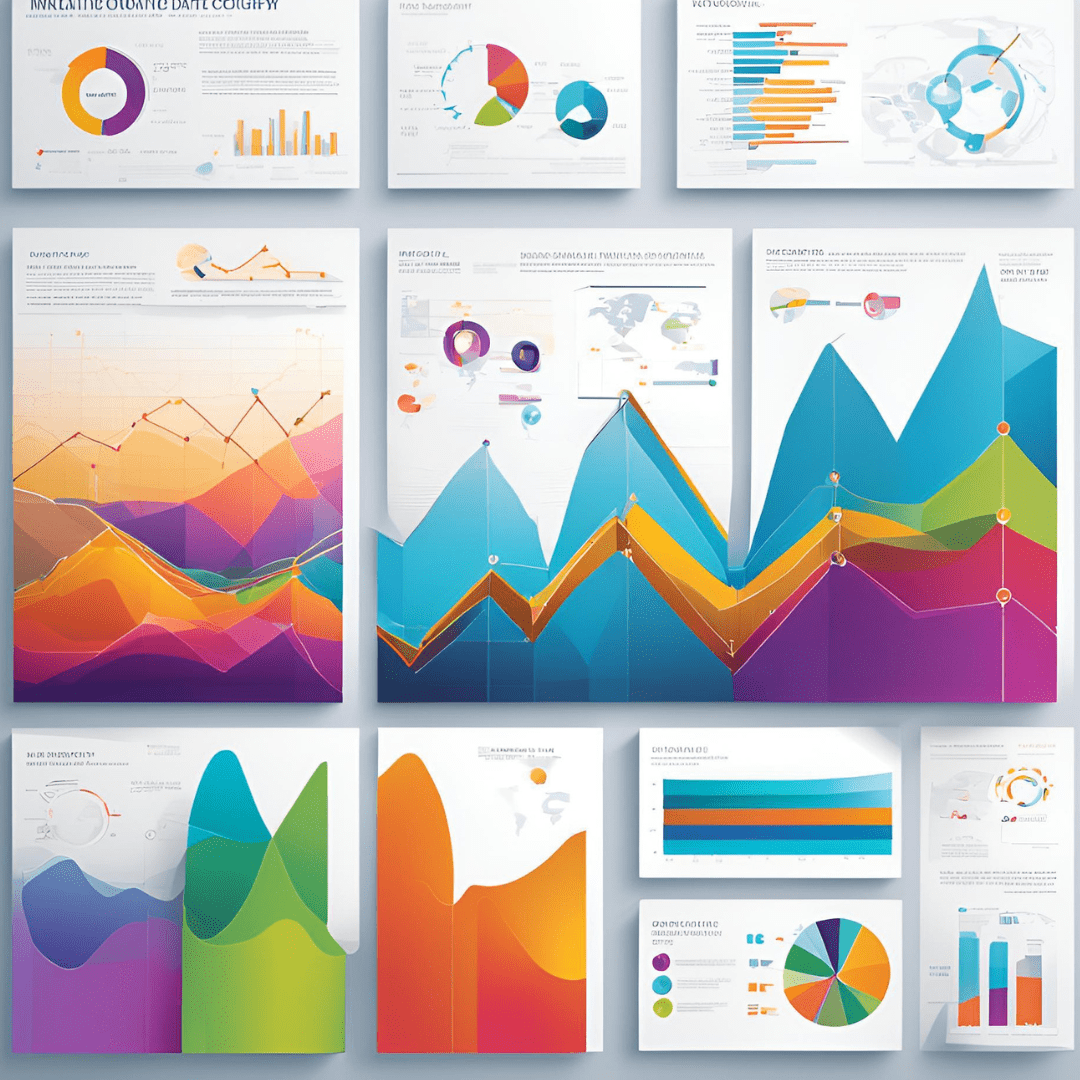
Today’s businesses succeed by turning raw data into impactful insights for decision-making. For industries operating in the B2B database sector, where massive volumes of complex data are generated daily, the need for intuitive, precise, and impactful data visualization is greater than ever.
The Role of Data Visualization in B2B Database Industries
At its core, data visualization transforms raw data into a visual context, such as charts, graphs, or dashboards, making patterns and trends more accessible. In the B2B sector, this capability is a game-changer. Here’s why:
Simplifying Complex Data
B2B databases often involve multi-dimensional data, such as client demographics, sales trends, and market dynamics. Visualization tools can distill this complexity into comprehensible insights, helping stakeholders understand key metrics at a glance.
Driving Data-Backed Strategies
Decision-makers require a clear view of their target markets and operations. Interactive dashboards that offer real-time analytics enable businesses to fine-tune their marketing campaigns, optimize lead generation, and identify high-value opportunities.
Enhancing Client Communication
Clear visual representation of data builds trust and transparency with clients. Whether presenting the ROI of a campaign or sharing performance benchmarks, data visualization bridges the gap between technical insights and client understanding.
Focus on Interactivity
Interactive visualizations allow users to dive deeper into specific aspects of data. Incorporating filters, drill-down options, and dynamic elements enhances user engagement and insight generation.
Ensure Data Accuracy and Integrity
Visualization is only as good as the data driving it. Implement robust data-cleaning processes to eliminate errors, missing values, or inconsistencies in the source database.
________________________________________
Emerging Trends in Data Visualization
The B2B database industry is rapidly evolving, and so are data visualization techniques. Here’s a look at the trends driving the future forward:
AI-Powered Visualizations: Machine learning algorithms are making it easier to identify hidden patterns and create predictive visual models.
Augmented Reality (AR) Dashboards: AR takes interactivity to the next level by overlaying data visualizations in a 3D space, enabling immersive analysis.
Personalized Reporting: Advanced tools now allow businesses to create tailor-made dashboards for specific stakeholders, improving relevance and usability.
________________________________________
How ValueData Research and Marketing Services Can Help
At ValueData Research and Marketing Services, we specialize in unlocking the potential of your B2B database with advanced data visualization solutions. Our expertise lies in crafting intuitive dashboards and visual narratives that empower businesses to make data-backed decisions with confidence.
From exploring market trends to optimizing client engagement strategies, our tailored visualization services ensure your data works harder for you. Excited to transform your data into actionable insights? Get in touch with us today and take the first step towards a more informed future.
In the competitive landscape of B2B industries, data visualization isn’t just an option—it’s a necessity. By turning complex datasets into actionable insights, businesses can unlock opportunities, foster stronger client relationships, and drive growth. Embracing this powerful tool ensures you stay ahead in the data race.
Transform your data into your greatest asset with ValueData Research and Marketing Services.
 By: @dmin / December 30, 2024
Leave a Comment